
close
Choose Your Site
Global
Social Media


Views: 0 Author: Site Editor Publish Time: 2026-10-10 Origin: Site


Mismatching a motor’s torque and speed to your application doesn't just reduce system efficiency. It actively leads to severe thermal overload, premature component failure, and costly project delays. Choosing incorrect parameters can destroy delicate mechanical systems almost instantly.
For design engineers and procurement teams, grasping the strict inverse relationship between speed and torque remains a critical first step. You desperately need this core knowledge for accurate, reliable component selection. It effectively prevents catastrophic design flaws during complex system integration.
This comprehensive guide breaks down exactly how to read torque-speed curves properly. You will learn to evaluate technical specifications against actual real-world load requirements. Finally, we will show you how to confidently shortlist the perfect DC Motor for your specific engineering application. By applying these principles, you ensure long-lasting product reliability and optimal mechanical performance.
The Inverse Rule: In a standard brushed or brushless DC motor, speed and torque have a linear, inverse relationship; as load (torque) increases, speed (RPM) decreases.
Optimal Operating Zones: Motors should be sized so their continuous operating load falls within their peak efficiency zone—not near their stall torque.
Voltage Dictates Speed: While torque is determined by the load and current, adjusting the supply voltage shifts the entire torque-speed curve up or down.
Datasheets are Idealized: Real-world thermal realities, power supply limitations, and mechanical friction often require a 20–30% safety margin above baseline calculations.
Reading the curve correctly prevents over-speccing and under-speccing. Over-speccing wastes valuable budget on oversized motors. Under-speccing risks catastrophic product failure under field conditions. You must balance both variables perfectly.
No-Load Speed ($\omega_0$): This represents maximum RPM when zero torque applies to the shaft. It proves useful for baseline comparisons across different models. However, it rarely serves as the actual operating speed.
Stall Torque ($\tau_s$): This shows the maximum torque generated when the shaft locks completely. Operating continuously near this point causes rapid thermal failure. The windings overheat and insulation melts instantly.
The Operating Point: This pinpoints the specific intersection of required load and desired speed. You must align it carefully against the rated continuous torque.
You will notice peak mechanical power occurs at roughly 50% of stall torque. However, peak efficiency behaves differently. It typically occurs at lower torque ranges. You usually find peak efficiency between 10% and 30% of stall torque. Operating here minimizes power lost as heat.
If you push operation beyond 50% stall torque, efficiency drops sharply. Electrical energy converts entirely into useless heat. This rapidly degrades internal components over time.
Torque-Speed Curve Operational Zones Reference
Operational Zone | Torque Level (% of Stall) | Speed Range | Typical Application |
|---|---|---|---|
No-Load Zone | 0% - 5% | Maximum RPM | Fans, light impellers |
High Efficiency Zone | 10% - 30% | Moderate-High RPM | Continuous duty actuators |
Peak Power Zone | 40% - 60% | Moderate RPM | Short burst acceleration |
Stall Danger Zone | 70% - 100% | Near Zero RPM | Locked rotor (Avoid) |
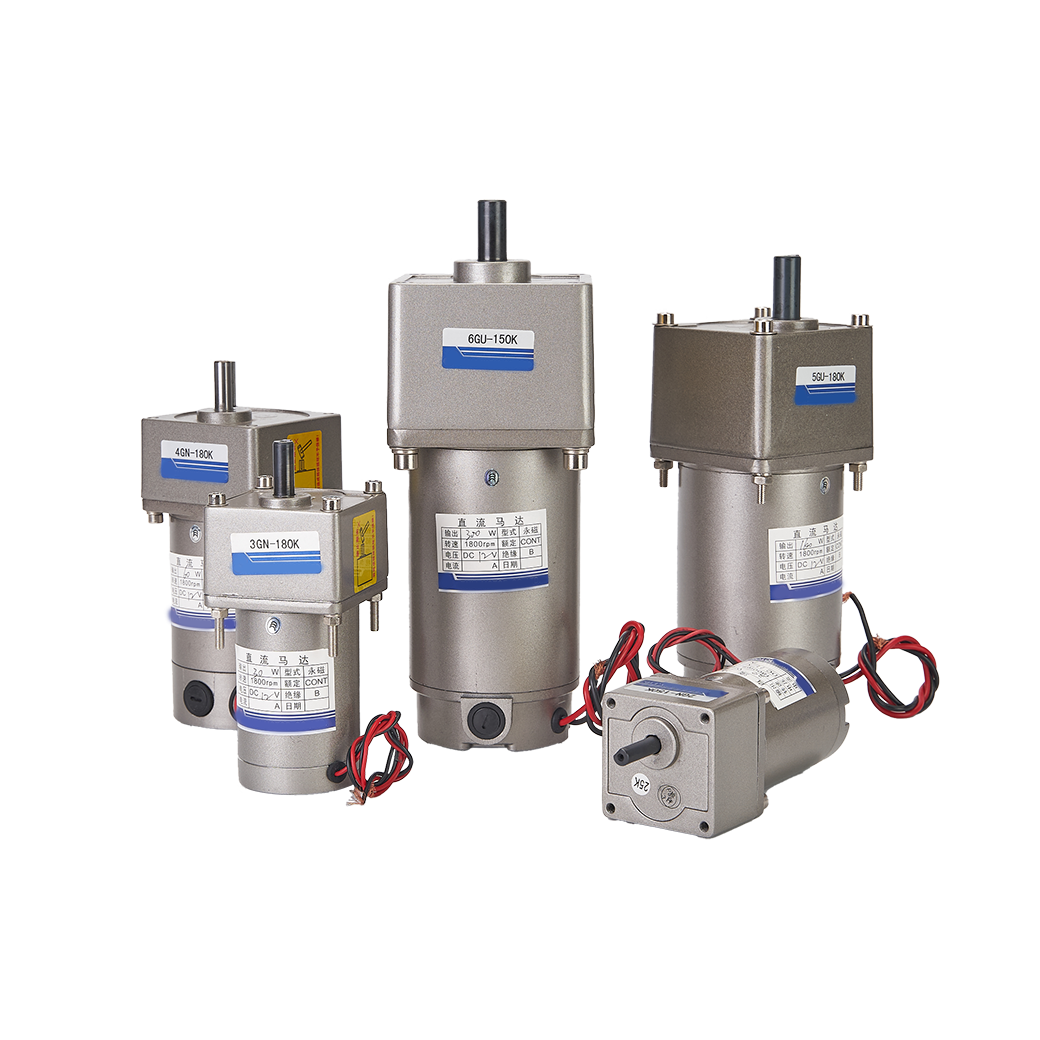
Deciding between a direct-drive configuration or a geared setup depends entirely on output requirements. You must carefully map these mechanical outputs to your intended use case. This ensures maximum lifespan and minimal maintenance.
Direct drive configurations deliver high RPM and low rotational force. They mount the load directly onto the output shaft. Typical examples include fans, blowers, and simple vibration motors.
A standard Brushless DC motor frequently utilizes direct drive. These setups offer excellent high efficiency. They also present very low mechanical wear over time. However, they remain highly prone to stalling under heavy external loads.
These configurations use a mechanical reduction system. They trade raw RPM for substantial mechanical advantage. Common planetary, spur, or worm configurations handle this task brilliantly. They multiply output force effectively.
Integrating a Gearbox proves ideal for robotics, heavy actuators, and lifting mechanisms. They conquer massive loads easily. However, they do introduce slight efficiency losses. You also gain mechanical complexity due to internal gear friction.
You must learn to look past basic marketing claims. Extract the true operational limits from any manufacturer's 12V or 24V datasheet. Theoretical numbers rarely match messy field realities.
Evaluate how voltage drops under heavy load. A power supply might sag significantly during peak current draw. This voltage drop will shrink your expected torque-speed curve immediately. It limits top speed drastically.
Battery-powered systems face this issue constantly. As battery charge depletes, the nominal voltage drops steadily. You must calculate performance based on the lowest expected voltage state.
Relying heavily on peak torque for continuous applications creates massive danger. Peak torque describes a brief, momentary capability. It does not reflect a sustainable operating condition.
You must understand the thermal time constant. It dictates how long a unit can sustain peak torque. Exceeding this exact time limit melts winding insulation. Complete electrical shorting follows moments later.
These two metrics help you mathematically predict behavior. They reveal performance at voltages and currents not explicitly listed on the datasheet. $K_t$ dictates how much torque generates per amp of current.
$K_v$ dictates how many RPMs generate per volt of supply. You can use these constants to model custom operating points accurately. They empower engineers to build highly reliable custom drive systems.
We believe highlighting transparent implementation realities builds ultimate engineering credibility. Too many projects fail due to simple, avoidable sizing mistakes. Understanding these common pitfalls protects your hardware investment.
Running a system too far down the torque-speed curve generates excessive heat. You encounter this in high torque, low speed scenarios. Heat increases internal electrical resistance rapidly.
Higher resistance demands more current to maintain the same mechanical force. This extra current creates even more heat. This vicious cycle degrades internal torque capacity until catastrophic failure occurs.
At zero RPM during startup, the unit briefly acts as a stalled motor. It draws massive, unrestricted current from the supply. This sudden spike creates severe electrical stress across the system.
You risk tripping power supply protections instantly. Unprotected PCB traces might literally burn off the board. Engineers must mitigate this using soft-starters or dedicated PWM control systems.
Failing to calculate starting friction ruins many designs. Mechanical systems suffer from stiction when resting. A setup might look perfect on paper but fail to move completely.
Guide rails, tight bearings, and heavy grease add significant resistance. You must measure this physical stiction accurately. Add it to your baseline torque requirement to guarantee reliable movement.
Procurement and engineering teams need an actionable workflow. This framework helps you confidently finalize your component choice. Follow these specific steps to guarantee optimal system performance.
Define the Worst-Case Load: Calculate both continuous running torque and peak starting torque. You must include acceleration requirements and mechanical stiction in this baseline calculation.
Establish the Desired Speed: Determine necessary RPM under the actual running load. Never base your design entirely on the manufacturer's idealized no-load speed metric.
Apply a Safety Factor: Multiply your baseline torque requirements by 1.2 to 1.5. This accounts for thermal degradation and expected mechanical wear over years of service. If your design requires extreme industrial force, you might specify a specialized High Torque 550W 800W DC Gear Motor to handle massive loads comfortably.
Request Samples and Prototype: Bench-testing remains a completely non-negotiable step. Test using the actual planned power supply before authorizing bulk procurement.
Selecting equipment requires moving far beyond isolated datasheet numbers.
You must map specific application load profiles carefully against full torque-speed curves.
Prioritize components where continuous operating points fall safely within high-efficiency zones.
Always budget generous safety margins for complex thermal realities in real-world environments.
Please contact our engineering team directly for a comprehensive datasheet review. We can supply prototype units to validate your torque and speed calculations on the test bench. Read more about us to discover our full range of custom electromechanical solutions.
A: Increasing voltage increases speed proportionally by shifting the entire curve up. It does not alter the underlying torque constant. However, higher voltage allows the unit to reach a specific target torque at a much higher RPM.
A: You cannot do this mechanically without changing the power input completely. You must either supply a higher nominal voltage to shift the curve upward, or select a larger physical model possessing a much higher overall power rating.
A: Stall torque defines the maximum possible force at exactly 0 RPM. Sustaining this will eventually burn out internal windings. Continuous torque defines the maximum steady load the unit handles indefinitely without exceeding critical thermal limits.
A: Datasheet speeds typically represent idealized no-load conditions at perfect nominal voltage. Real-world applications introduce heavy mechanical loads, internal friction, and battery voltage drops. All these external factors combine to reduce operational RPM significantly.


